Before diving in, make sure you’ve:
- Completed the onboarding flow, check out Integrations for more info
- Added Deeptrace to a channel with engineering alerts
Investigate Alerts in Slack
When an alert fires, Deeptrace acts as your first responder in Slack, gathering context, correlating signals, and synthesizing a root cause within minutes. You’ll see a message like this in Slack:
Debug with Deeptrace
In Slack, simply type@Deeptrace to ask questions about recent investigations, explore what’s happening in your system, or debug issues in real time alongside Deeptrace.
Create a PR & Make a Ticket in Slack
When Deeptrace completes an investigation, you can create a PR directly in Slack by selecting Create PR. Use Make Ticket to automatically create a ticket in Linear or Jira capturing the issue, root cause, and proposed fixes so nothing gets lost after an incident.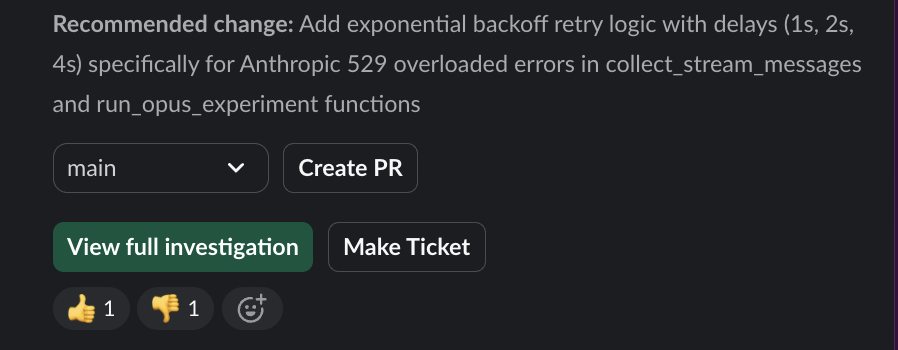
Thumbs up / Thumbs Down
Use thumbs up or thumbs down under an investigation to train the agent on what good root causes look like for your system, so investigations get more accurate over time.
Owner Attribution
What’s Next?
Features
Explore advanced features in the Deeptrace web view like rule-based filtering and custom context to customize how your team investigates and collaborates with Deeptrace.