Access the Web View
At the bottom of each Deeptrace investigation, you’ll find a “View full investigation” button that opens the full web view. In the web interface, you can examine every retrieved data source (logs, traces, commits) with embedded, clickable citations for each claim Deeptrace makes.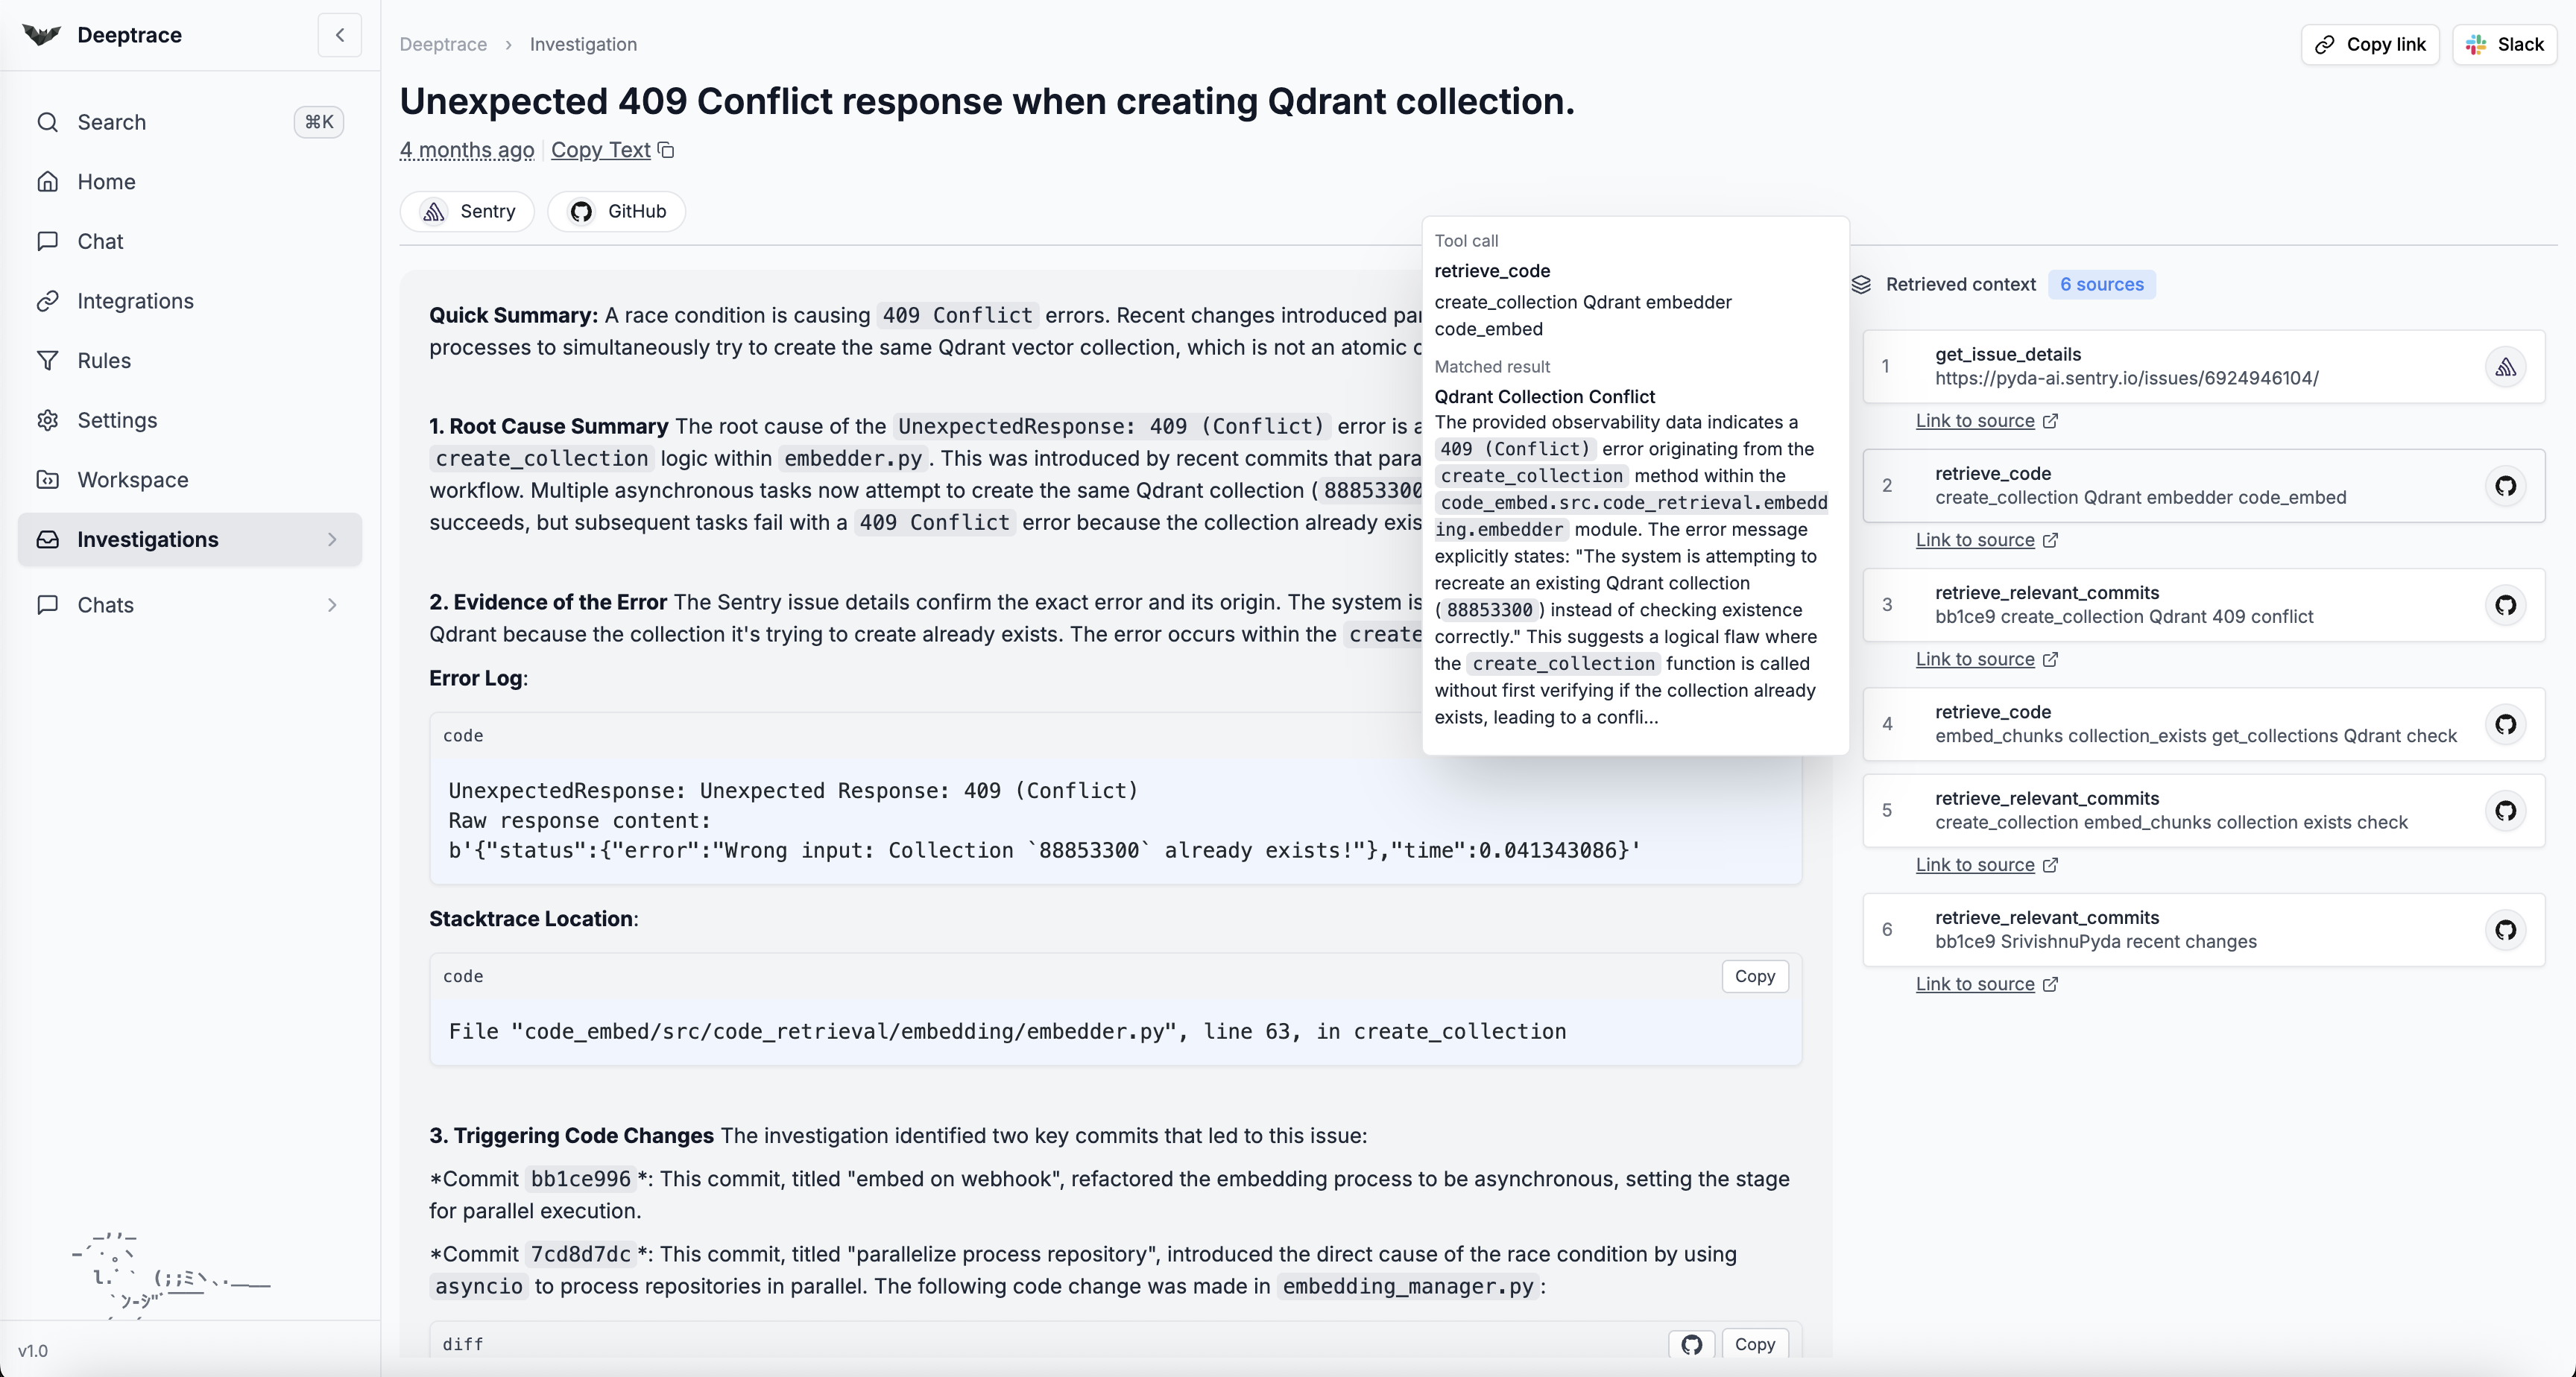
Rule-Based Alert Filtering
Use Deeptrace’s rule-based filtering to control which alerts trigger an investigation. To set up Rules, you can either:- Enable automatic filtering for repeat or duplicate alerts
- Filter by keywords (e.g. “timeout”, “error 500”) or enable AI-based matching
- Assign rules to specific bots and channels for targeted control
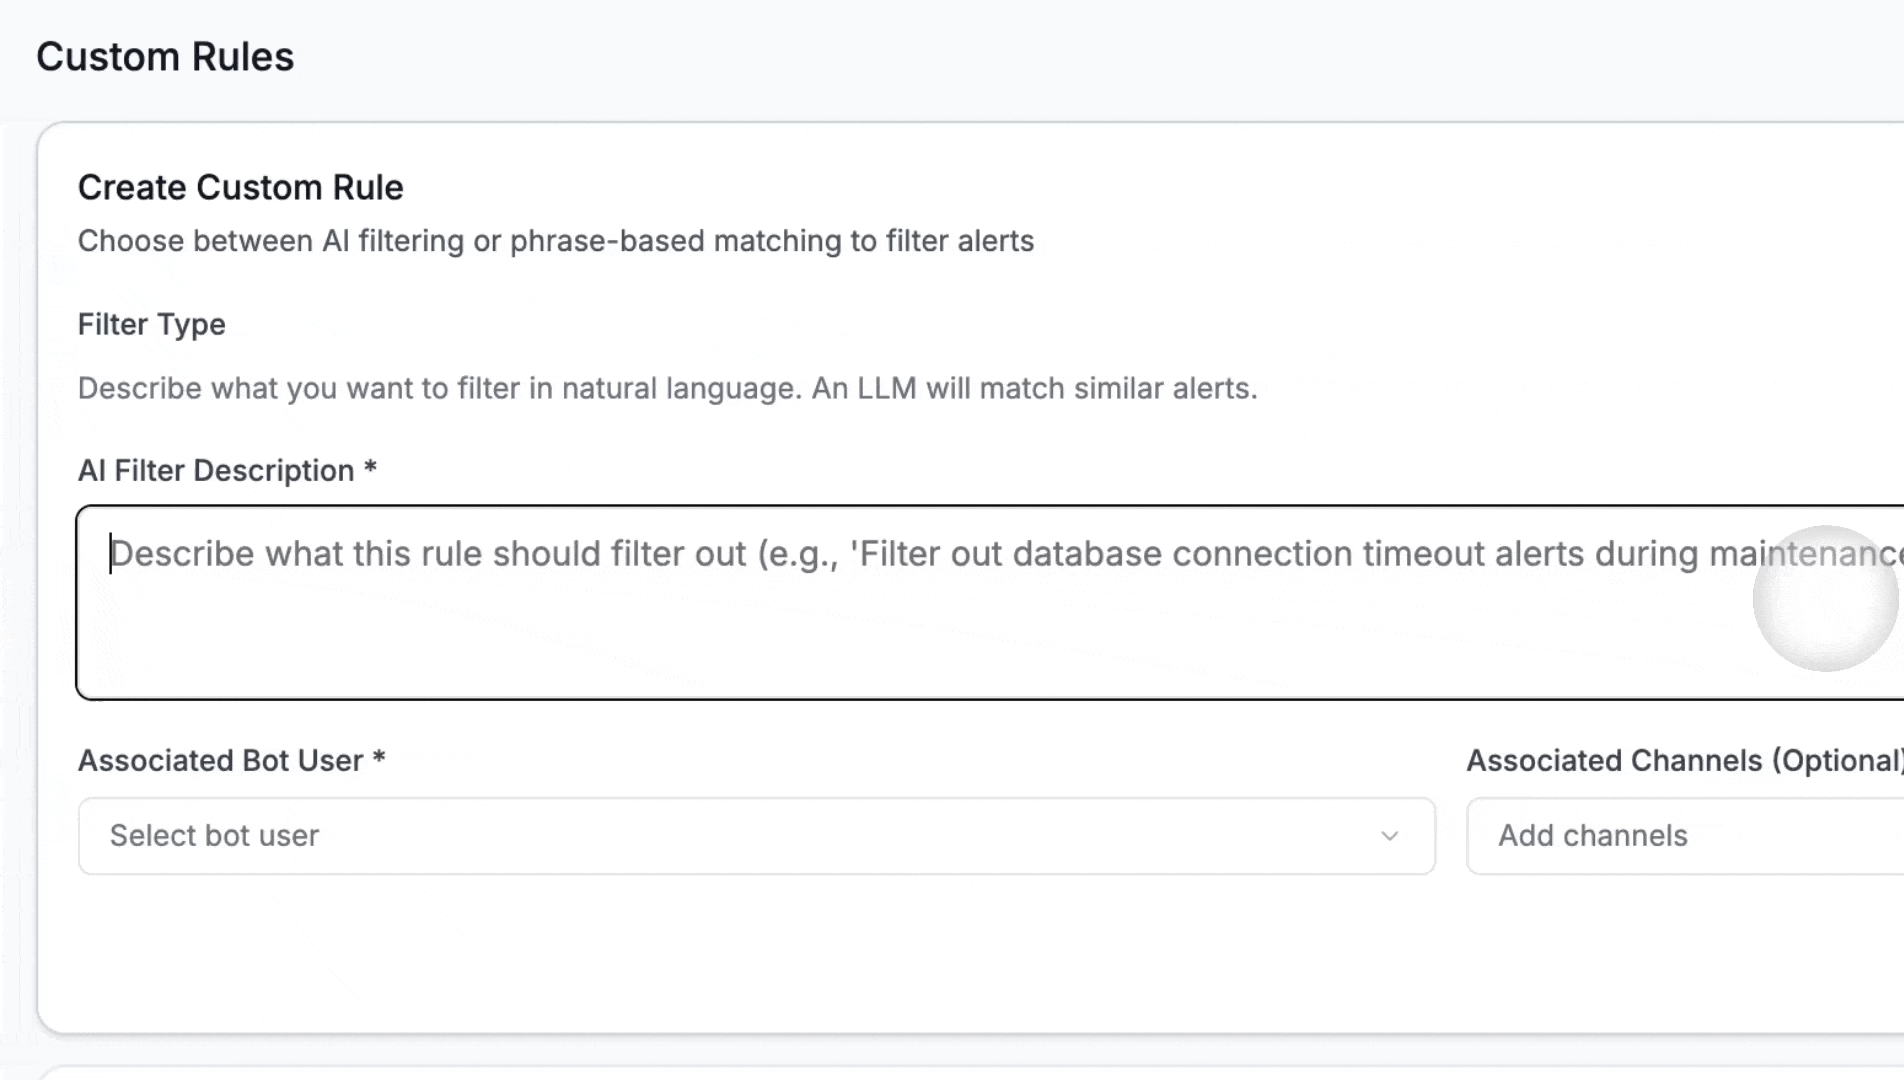
Note: Without rules, Deeptrace automatically triggers on all engineering alerts in your Slack channel.
Chat with Deeptrace in the Web View
Use the Chat tab in the web dashboard for a co-pilot like experience. Ask Deeptrace questions about recent issues and explore them conversationally with full system context.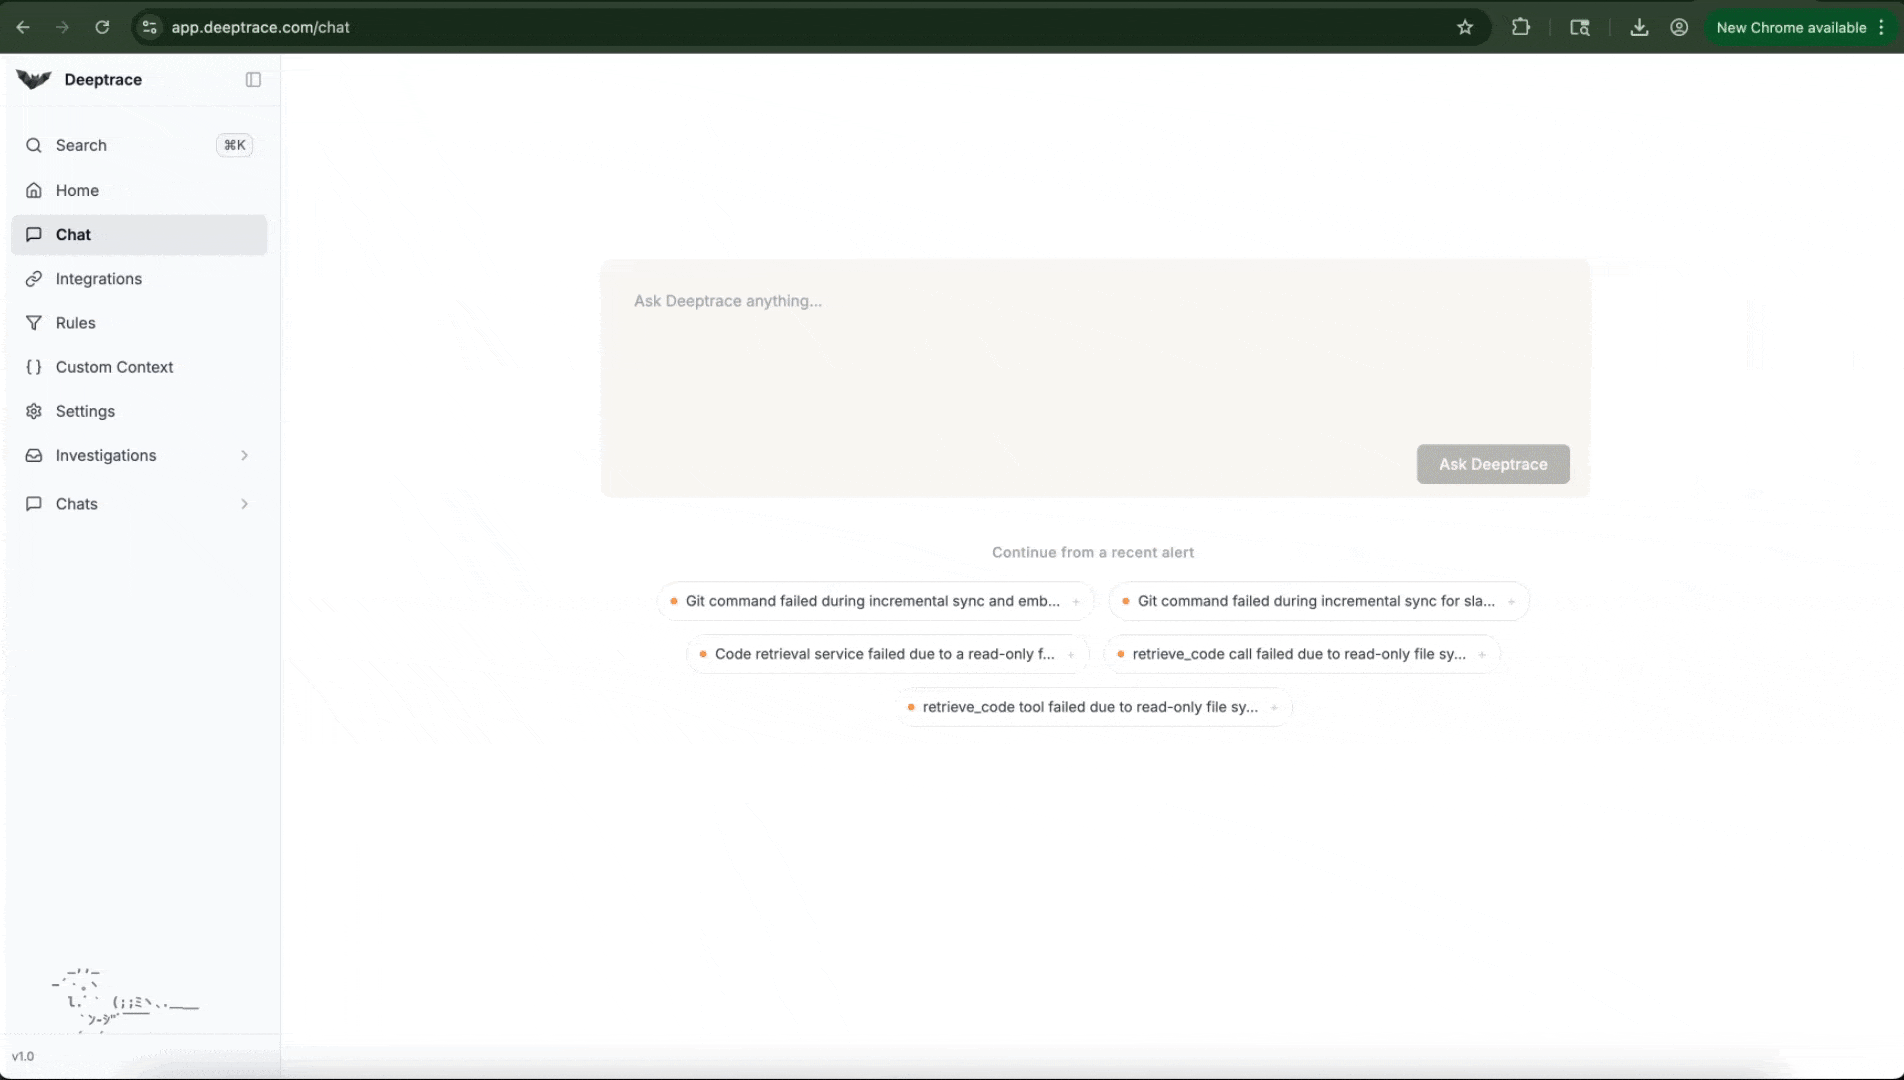
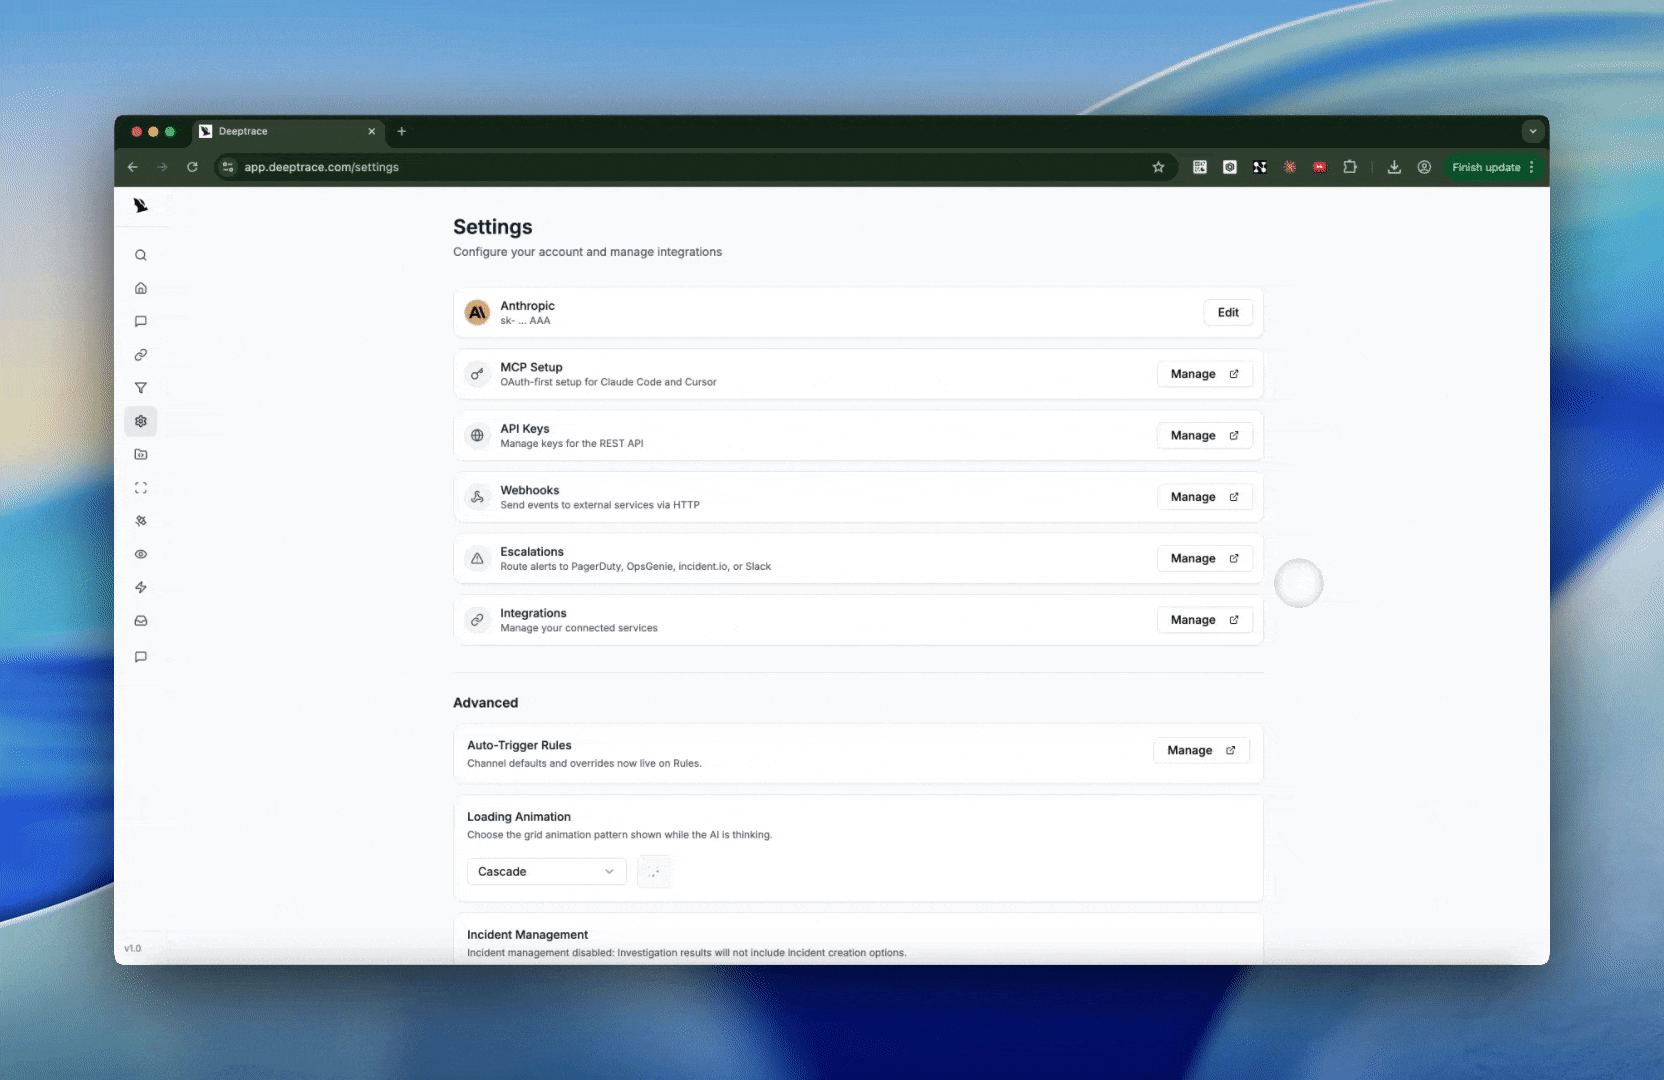
Custom Context
Use the Workspace Editor to curate custom context that guides Deeptrace’s chats and investigations. In the workspace editor, create files to define best practices for querying observability tools and investigating incidents.
Issues Page
Use the Issues page to proactively surface and prioritize issues in production. Run a scan over your production data to group repeated incidents by severity, track frequency, and generate a concise list of actionable issues. Drill into each issue to view a detailed bug report and linked investigations, and schedule recurring scans to keep a continuously up-to-date view of what’s breaking in prod. Once a scan is completed, click Suggestions to surface the highest-impact fixes Deeptrace can make, areas to add logging, how to close observability gaps, and which PR-ready changes will prevent this class of issue from reoccurring.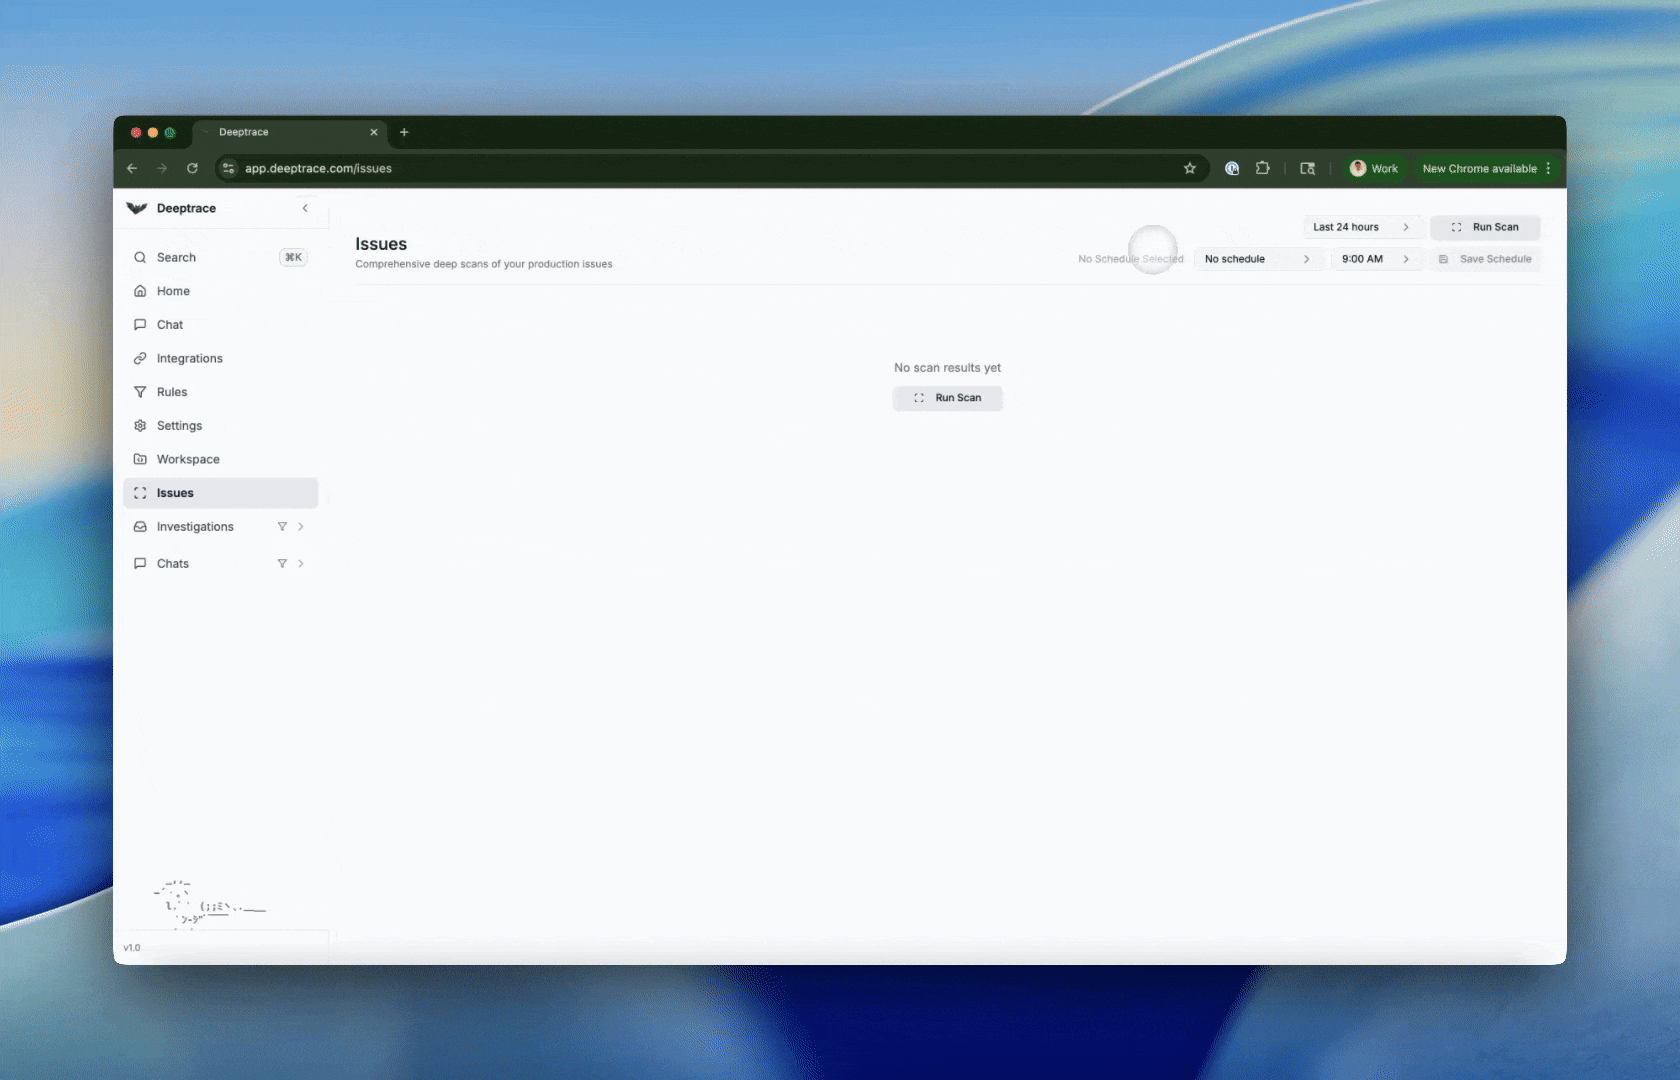
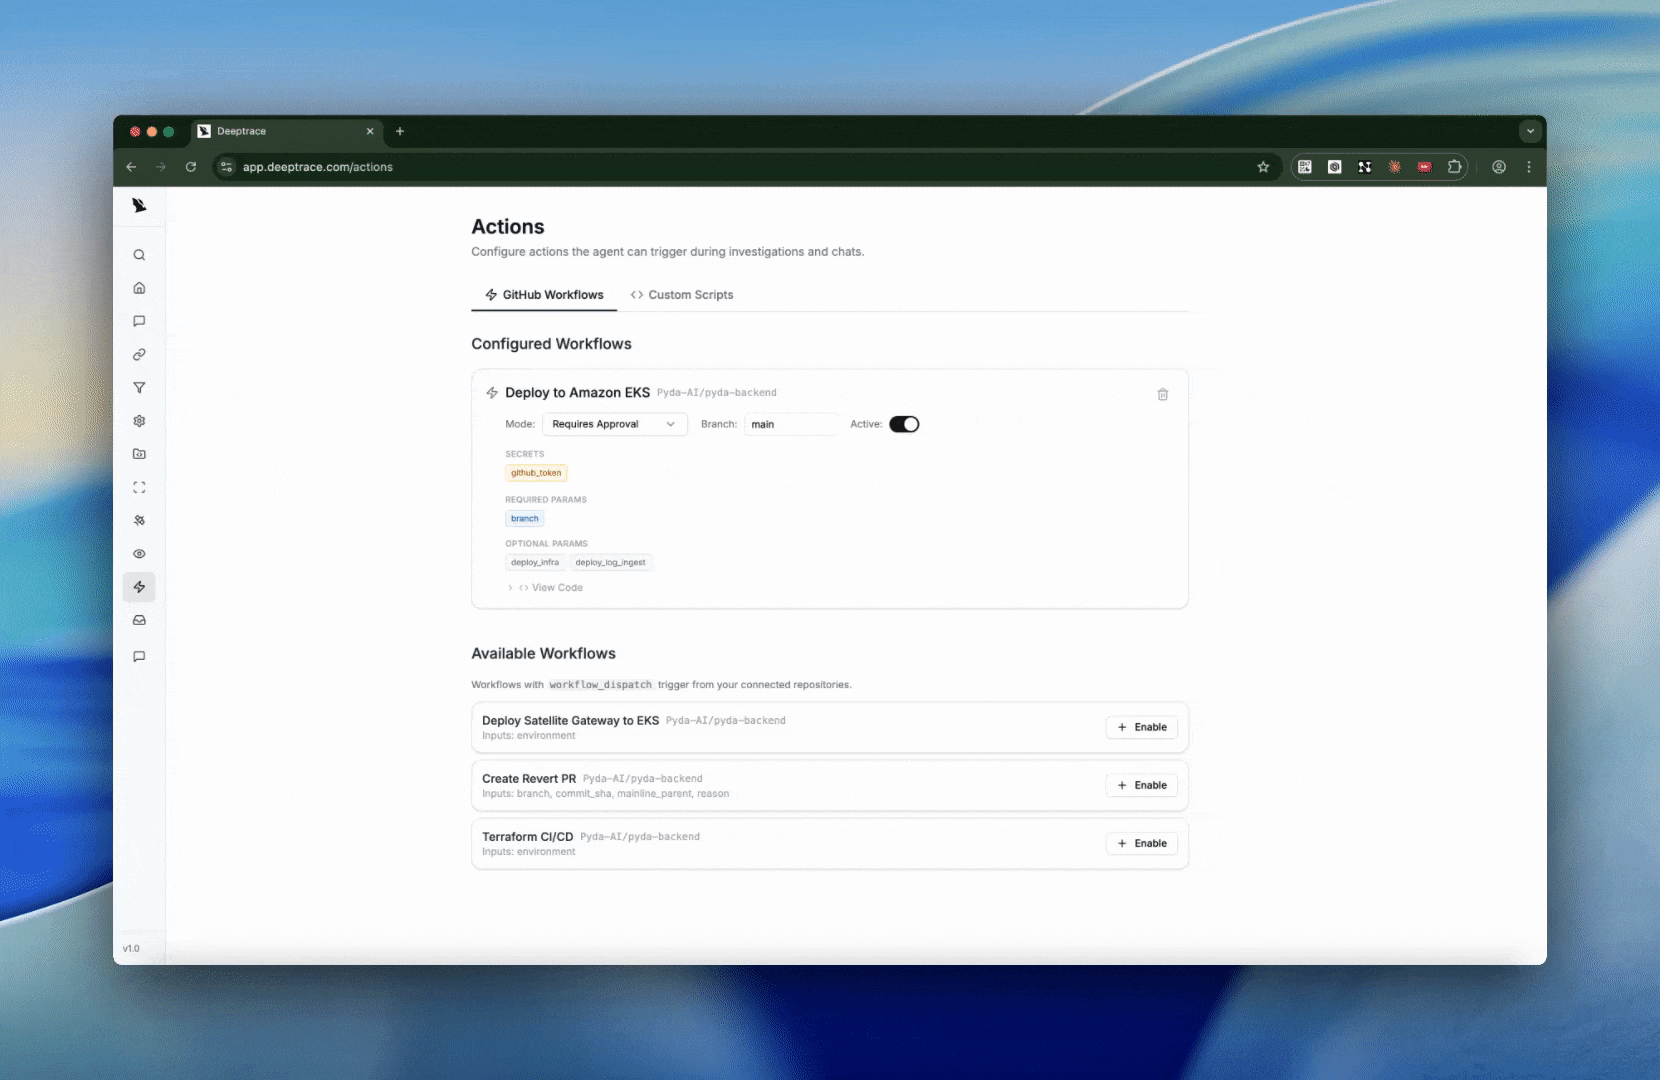
Actions
Escalations